Chinese Americans:
A Survey Data Snapshot

- All Asian Americans
- Chinese Americans
- Filipino Americans
- Indian Americans
- Japanese Americans
- Korean Americans
- Vietnamese Americans
简体中文/ Simplified Chinese | 繁体中文/ Traditional Chinese | 繁体中文/ Taiwanese
About 4.7 million Chinese Americans lived in the United States as of 2022, according to data from the U.S. Census Bureau. They account for 19% of the nation’s total Asian American population.
Six-in-ten Chinese Americans are immigrants, while four-in-ten are U.S. born. Two states – California and New York – are home to about half of all Chinese Americans.
The median income among Chinese American households was $98,400 in 2022, meaning that half of households headed by a Chinese American person earned more than that and half earned less. This is similar to the median household income among Asian Americans overall that year ($100,000).
Here’s a closer look at Chinese Americans’ attitudes on a range of topics, including how they describe their own identities, how they view the U.S. and China, and how they feel about achieving the American dream.
These findings are based on a nationally representative Pew Research Center survey of 7,006 Asian adults in the U.S. – including 1,617 Chinese American adults – conducted in 2022 and 2023.
Identity
Chinese Americans describe their identity in many ways, as is the case among Asian Americans overall. About half of Chinese Americans (53%) say they most often describe themselves as “Chinese” or “Chinese American.” About a third (34%) typically describe themselves as “Asian American” or “Asian,” while 8% call themselves “American.”
Some Chinese Americans say they’ve hidden a part of their heritage – such as cultural or religious practices – from people who are not Asian. In our survey, 19% say they have done this.
Views of the U.S. and China
Chinese Americans have a broadly positive opinion of the U.S.: 72% see the U.S. very or somewhat favorably.
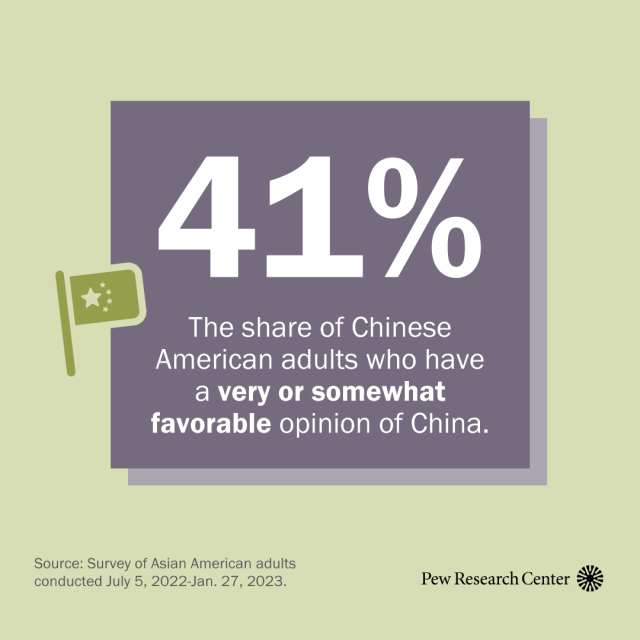
By comparison, just 41% of Chinese Americans see China favorably. In fact, Chinese Americans are the only major Asian origin group in the U.S. in which a majority of adults do not have a favorable opinion of their own ancestral homeland.
Most Chinese Americans say they would not move to China; just 16% say they would. Among those who would move to China, 27% say the main reason is to be closer to their friends or family and 24% say it’s because they’re more familiar with the culture.
Achieving the American dream
Most Chinese Americans feel that they’re on their way to achieving the American dream or have already achieved it. Around half (51%) say they’re on their way, while a quarter say they’ve already achieved it. However, 23% of Chinese Americans say the American dream is out of reach for them.
Politics
A majority of Chinese American registered voters (56%) identify with or lean to the Democratic Party. Another 39% are Republicans or lean Republican. By comparison, among Asian American registered voters overall, 62% are Democratic or Democratic-leaning and 34% are Republican or lean to the GOP.
As of 2022, about 2.7 million Chinese Americans – or 58% – were eligible to vote, according to Census Bureau data. That means they were at least 18 years old and a U.S. citizen through birth or naturalization.
Religion
Chinese Americans are among the most likely Asian origin groups to be religiously unaffiliated. More than half of Chinese Americans (57%) are not affiliated with any religion, compared with 32% of Asian Americans overall.
Another 22% of Chinese Americans identify as Christian, including 12% who identify as evangelical Protestants and 5% who are nonevangelical Protestants.
Photo by Drew Angerer/Getty Images
Source https://www.pewresearch.org/race-and-ethnicity/2024/08/06/chinese-americans-a-survey-data-snapshot/
![]()